

The basic question assessed every time in our analytics projects is "How do we turn data into value for the business?"
Nearly everything or everyone is collecting data about something. Or about everything. When everything is trackable, naturally, you end up with a lot of data. I mean, a lot. What easily happens to many of us is that we end up with a bunch of data, and we don’t know what to do with all of it. The data is all there, but the question is, how do we turn it into valuable insights? And, more importantly, how do we turn those into meaningful actions?
Getting started
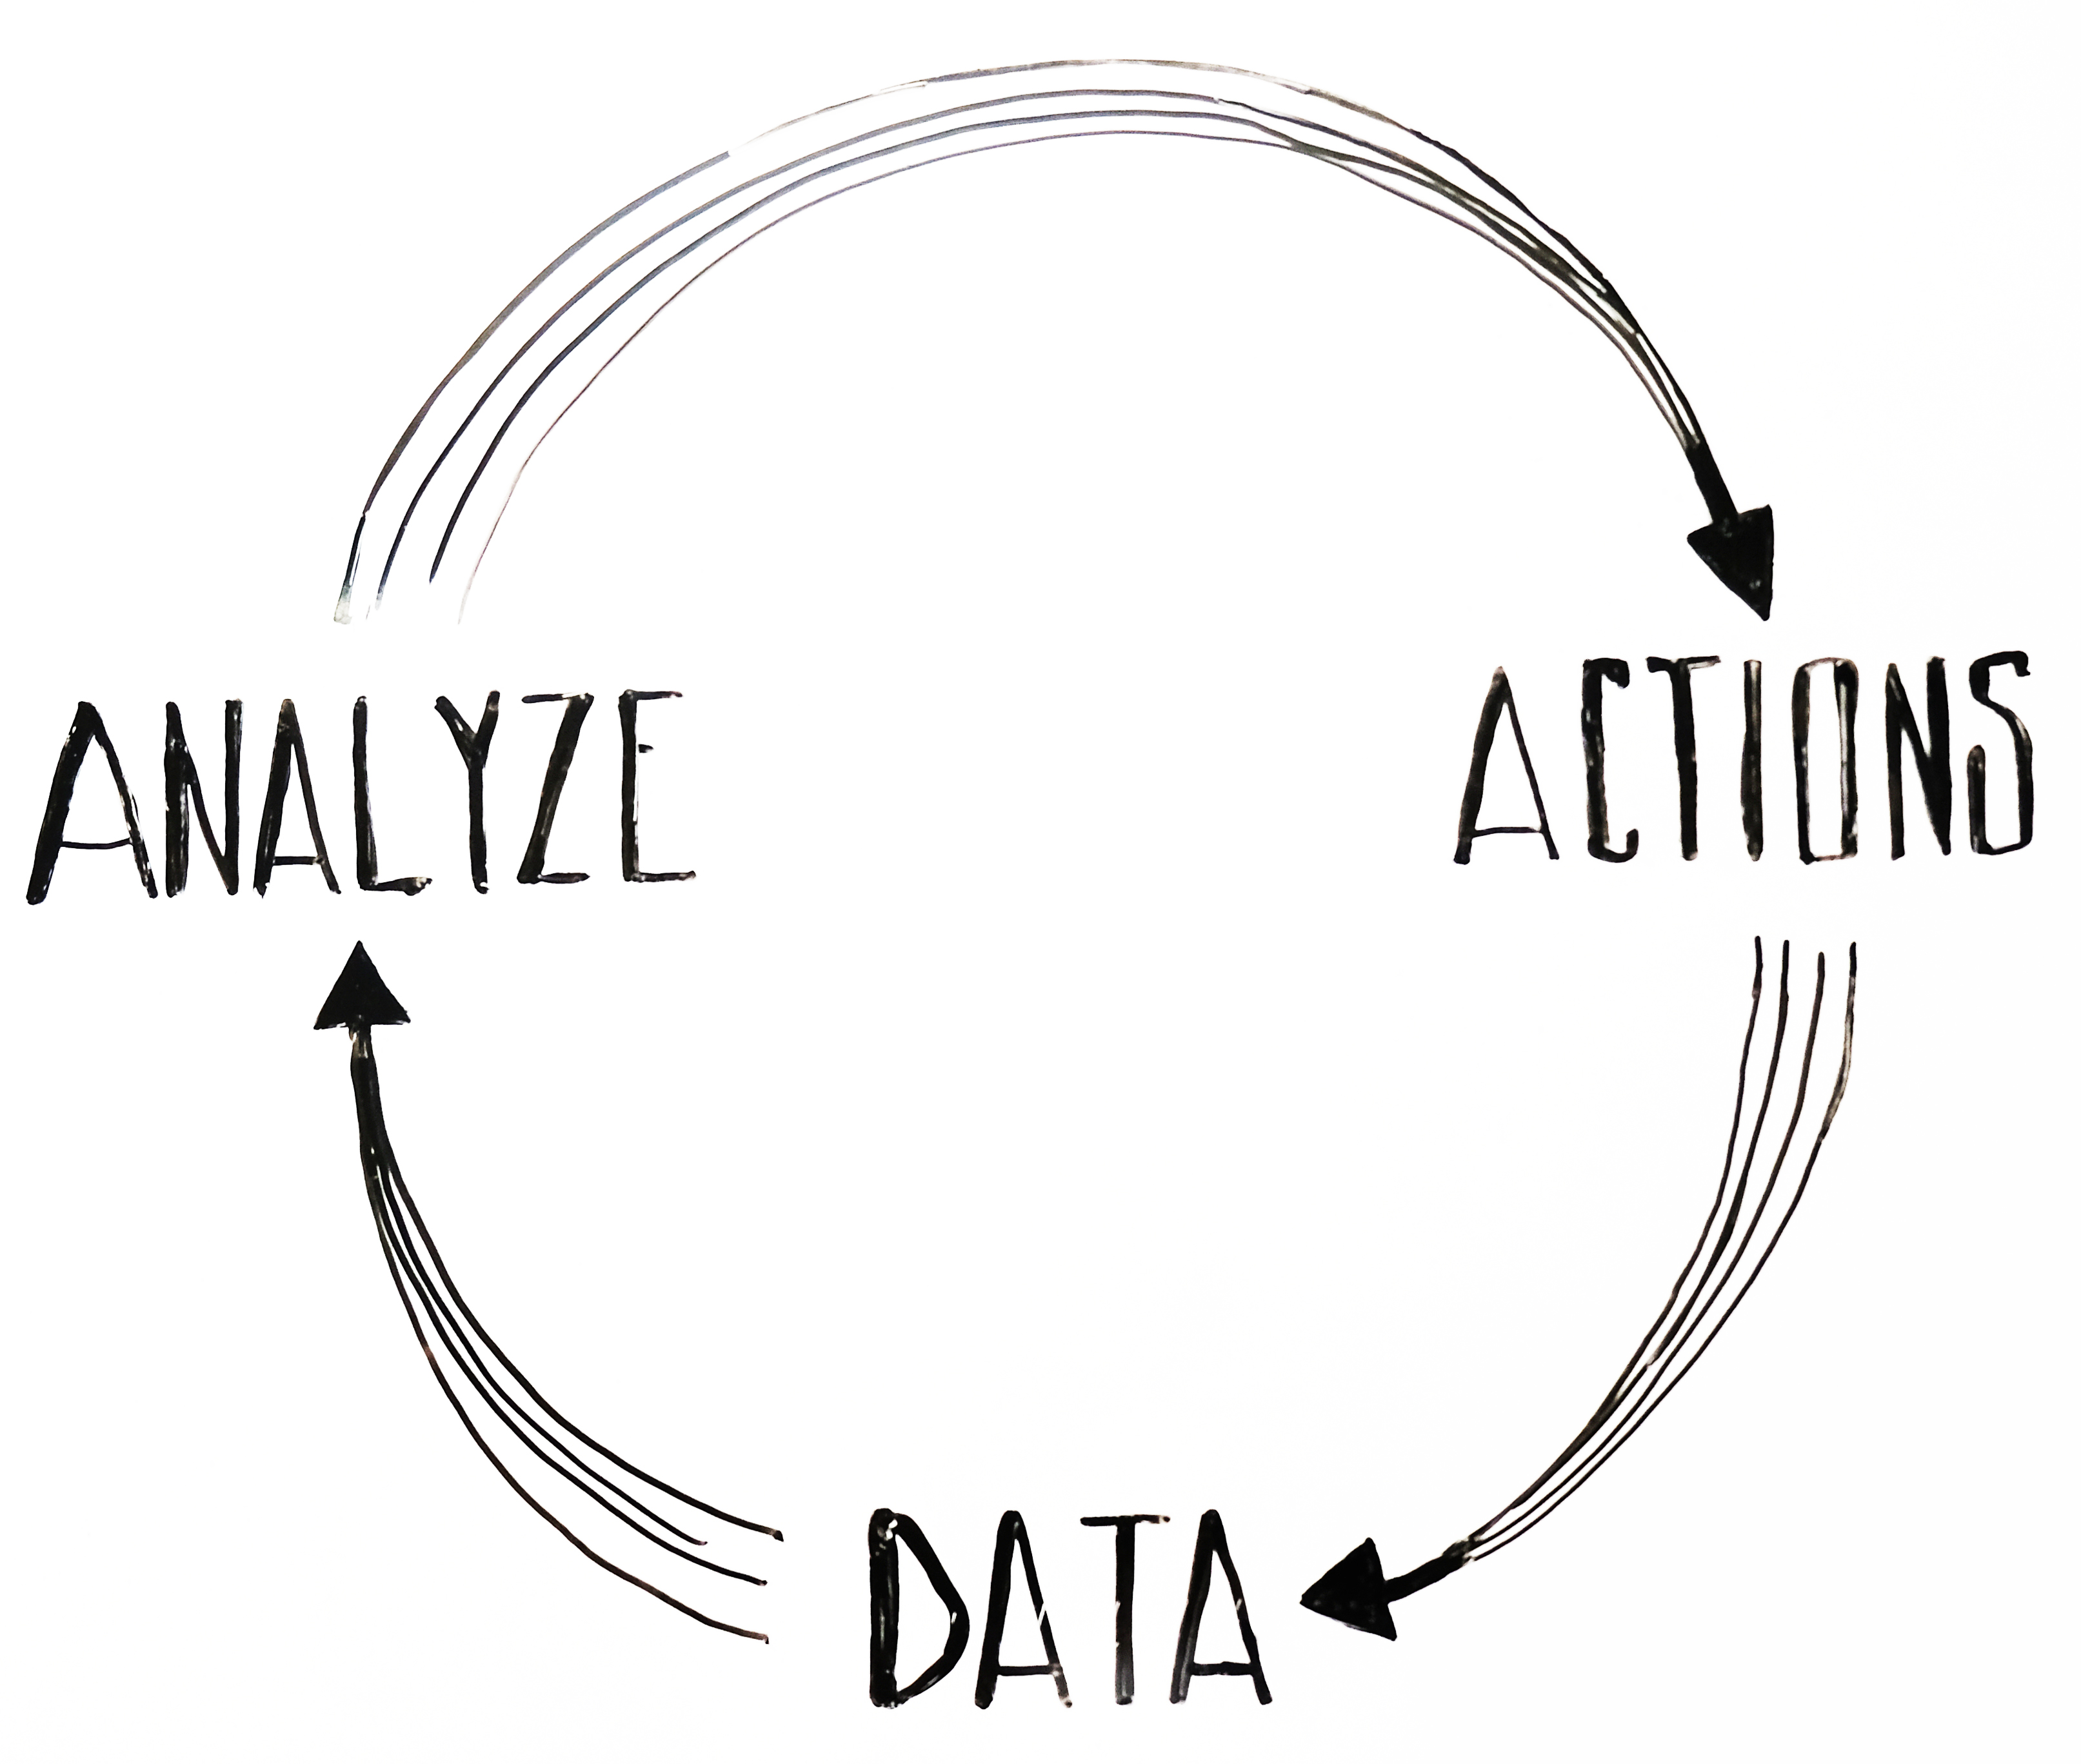
Let's get started with the analytics cycle, that leads data to analysis and turns this analysis into actions. The main ingredient here is obviously data.
The wonderful thing about data is that it comes in all shapes and sizes, and from various sources. When it comes to analyzing, one sided data doesn’t serve us that well. To really understand the meaning of data, we need to dive in to different data sources to identify relationships between data, actions and consequences. Yet, combining data from different sources and making any sense of it can be a daunting task.
Your website/company/brand is most likely visible in multiple places. For example, not only is your company visible in Facebook or Twitter: how about posts, shares, impressions, conversions... these also needs to be monitored. How have your posts been visible? What’s the reach of each individual post? And further on, how has different posts affected your site traffic?
Towards analyzing
After connecting with the data sources, the data needs to be transformed and the use defined. The use can also be defined as KPI’s before data sources are linked. This type of model is more commonly used when building dashboards for a specific use.
Defining what data to use can be tricky, but usually we have a ‘hunch’ what could be the problem. As we get data insights, the focus might change to another data sources in the next iterations. Defining the data precisely is different for the cost side of things. Usually the data from different data sources is being queried from cloud services, where more data queries mean more costs.
Two main models are used in data mining; predictive or descriptive analysis. Descriptive analysis describes what has happened - valuable if you describe the right things. Predictive analysis uses mathematical models to predict what will happen, for example, regression or classification. Also valuable, if you can find the right insights from the data, with which you can plan your next actions.
This stage is very dependent on the amount of data and the amount of sources. Data can’t only be looked at its own independent silo, but as a larger picture. Dashboards can be useful to connect many data sources in one visible scene to reveal relationships, but also to just take on quick overlook on the present situation, mostly used by management teams.
Done, for now
Finally, the last step of our cycle is to make the changes as a result of our analysis results. These actions try and fix the problems that we have found out from data analysis or to utilize now revealed opportunities.
Like in most things, we can’t get results without actually doing the work. Analyzing data doesn’t give us the answers how to enhance things, but shows us problems and gives us insights. The development of a website must be based on factual information about real usage patterns. A guess is just not good enough.
From these insights, we can define our actions. Actions can be basically anything from UX design to roadside marketing.
Want to know more about how Sangre could help your company develop your product towards an even better version of itself? Contact us for more info: [email protected], +358 40 864 7800.


